End user tracing in a network deployment
Scenario
User has deployed DNS Firewall at a network level. In such cases, DNS Firewall has visibility on domains accessed at the network level and not on the endpoint which initiated the request. In case of malicious domains reported in DNS Firewall logs, the source device which initiated the request needs to be remediated to fix the root cause. This document is intended for use by organizations which use MS Server DNS service and who wish to enable capturing of DNS requests and co-relate domain requests with endpoint device IP address.
MS Server 2019, MS Server 2022
Steps to enable DNS debug logs
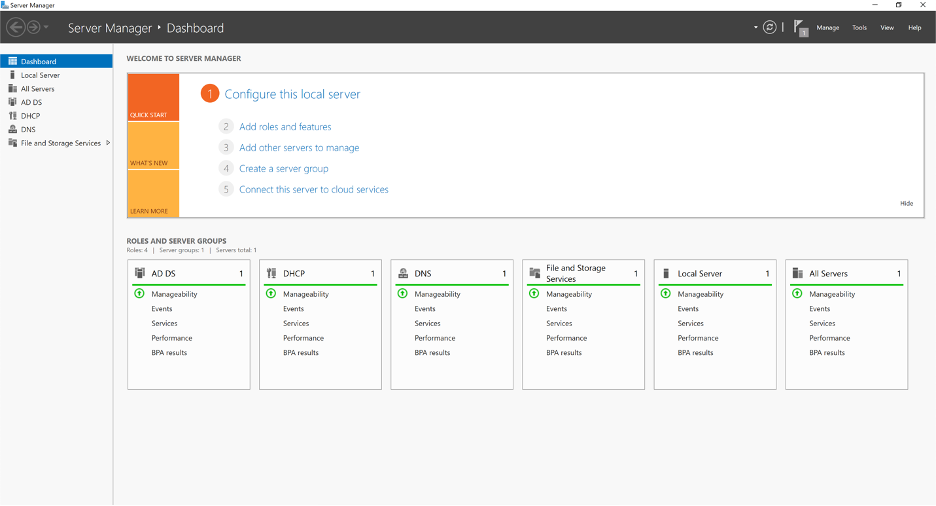
Step 1: On MS Server Manager screen, select DNS server group.
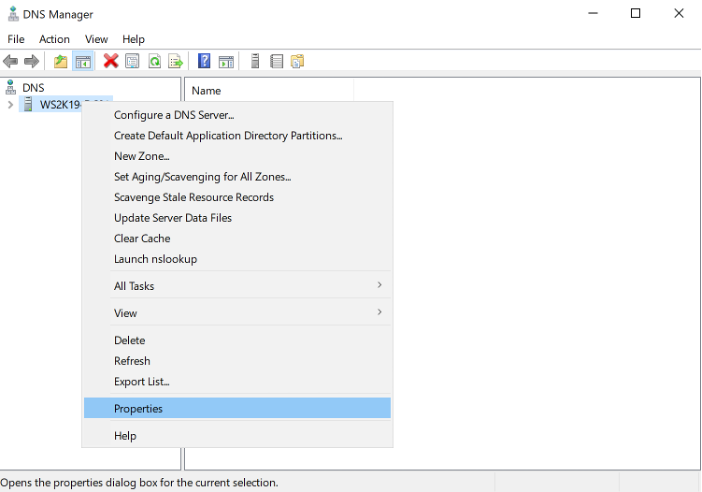
Step 2: Under DNS node, right click on the DNS server you wish to enable logging for. Click on properties.
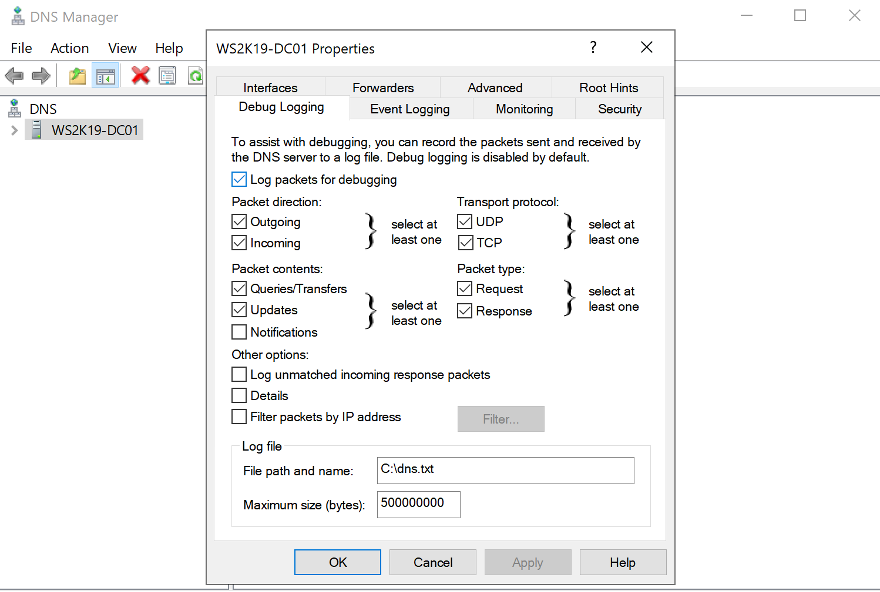
Step 3: Select ‘Debug Logging’ tab and enable options as shown in the screenshot below. Specify log path as appropriate.
Verification of set-up in a lab environment
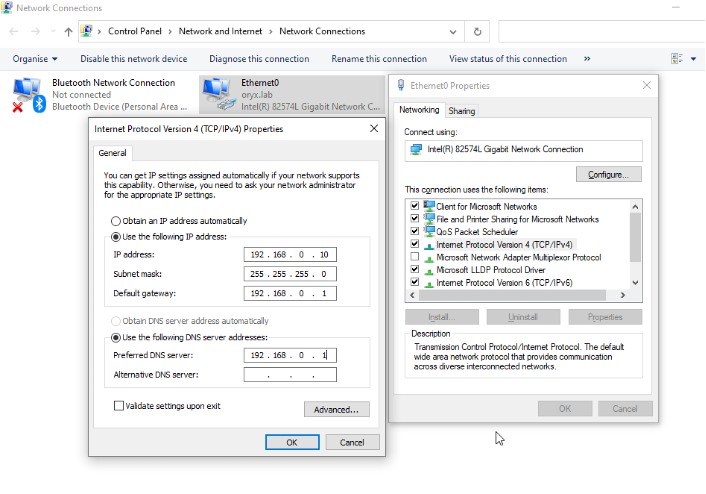
Below is a sample client in lab environment which has an IP address of 192.168.0.10.
To illustrate debug logs in action, from the client device access example.com

The DNS logs will start populating as shown in the screenshot below, will reflect the time stamp, source IP of the client and the domain in addition to other details about the request. This can be used to trace the source IP of the device that accessed a domain. Please note, there can be a delay of 1 to 2 mins before the logs are updated.
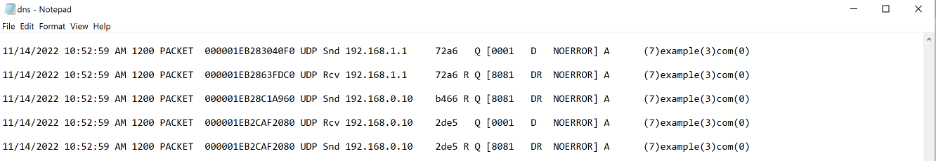
With the endpoint IP details available, admins can remediate the root cause of malicious requests.